
Daily Showing Activity Across North America
The chart below tracks daily showing activity across North America and in individual states and provinces.
(click on a state or province to see the impact in your area)
Data Available
Data Not Yet Available

Additional COVID-19 Resources
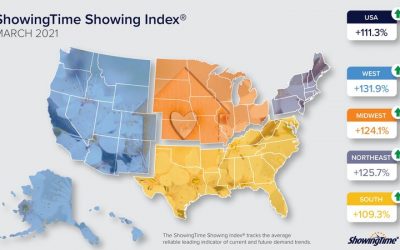
March 2021 Showing Index Results: Sustained Buyer Demand Leads to Lower Inventory, Higher Prices
April 21, 2021 - Buyers continued their frenzied pace in March despite limited inventory, with 129 markets recording double-digit showings per listing compared to the previous high of 82 markets in February, according to data from the ShowingTime Showing Index. For...

February 2021 Showing Index Results: Home Buyer Demand Jumps 98.4% in the West as Traffic Grows Again Nationwide
March 24, 2021 - Dwindling inventory was again met with an outpouring of buyer demand throughout the country in February as an unprecedented 75 markets reported double-digit growth, according to the ShowingTime Showing Index®. “Seeing 75 markets experience that level...
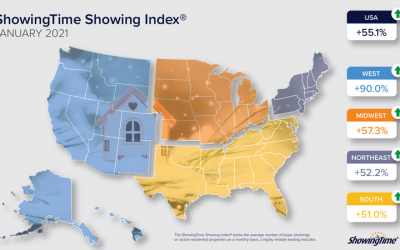
January 2021 Showing Index Results: Showings-Per-Listing Up, Inventory Down as 2021 Starts on a High Note
Home shoppers carried their end-of-year showing activity momentum into January, with home tours across the country up 55.1 percent year-over-year as more listings came on the market in some metro areas, according to the ShowingTime Showing Index®. "Austin, Boulder,...

November 2020 Showing Index Results: Buyer Activity Remains Strong
November’s normal seasonal slowdown was upended again according to the ShowingTime Showing Index®, with showing traffic across the country up 47.2 percent year-over-year as buyer activity extended its late-season surge across the U.S. These year-over-year increases...

October 2020 Showing Index Results: Heavy Buyer Demand Continues
The ShowingTime Showing Index® found that October's normal seasonal slowdown was upended, with year-over-year showing activity continuing to surge across the U.S. More than 25 markets, especially in the West, Northeast and the South, were indicative of these showing...

Positive Takeaways From 2020
As we near the end of what’s proven to be a trying year, you would be forgiven if you wanted to leave 2020 without looking back. But while it’s been a challenging year in many ways, inspiring examples of individuals rallying to overcome obstacles were everywhere in...