Did you know that ShowingTime is now part of ShowingTime+, a software suite that helps agents, brokers and MLSs streamline their businesses and deliver elevated experiences to their customers by combining existing solutions from ShowingTime and dotloop, along with introducing new solutions like Listing Media Services and the forthcoming Listing Showcase? Be sure to bookmark the ShowingTime+ homepage (showingtimeplus.com) to stay up to date on the latest offerings we provide to simplify your workflow.
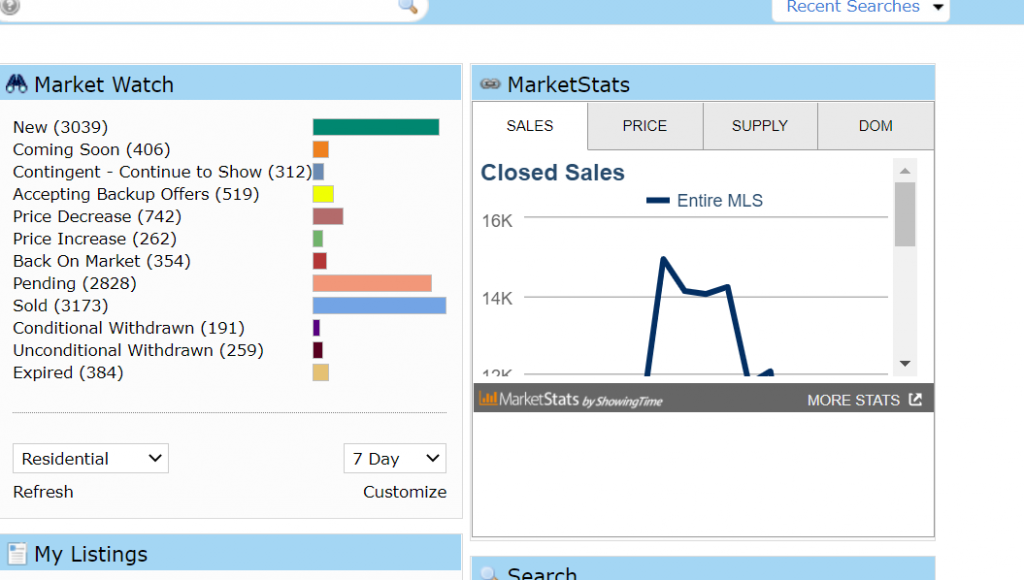
Wouldn’t it be nice to tap a button to quickly access the data you need? That’s exactly what you can do with ShowingTime’s one-tap widgets!
These widgets, which may be found on your MLS dashboard or home page, include MarketStats, InfoSparks, FastStats and our general ShowingTime widget. They allow you to authenticate into the products quickly and easily without having to visit multiple sites. With widgets, your dashboard is a one-stop shop.
Across most markets in North America, available housing inventory continues to be extremely low. Having in-depth and up-to-date housing data and market statistics from ShowingTime helps you better explain market conditions to potential clients such as why it’s currently a seller’s market.
Not only does such data help in listing presentations, but it also enables you to position yourself as the local market expert by using MarketStats’ tools to post and share relevant data on your website, blog or social media profiles.

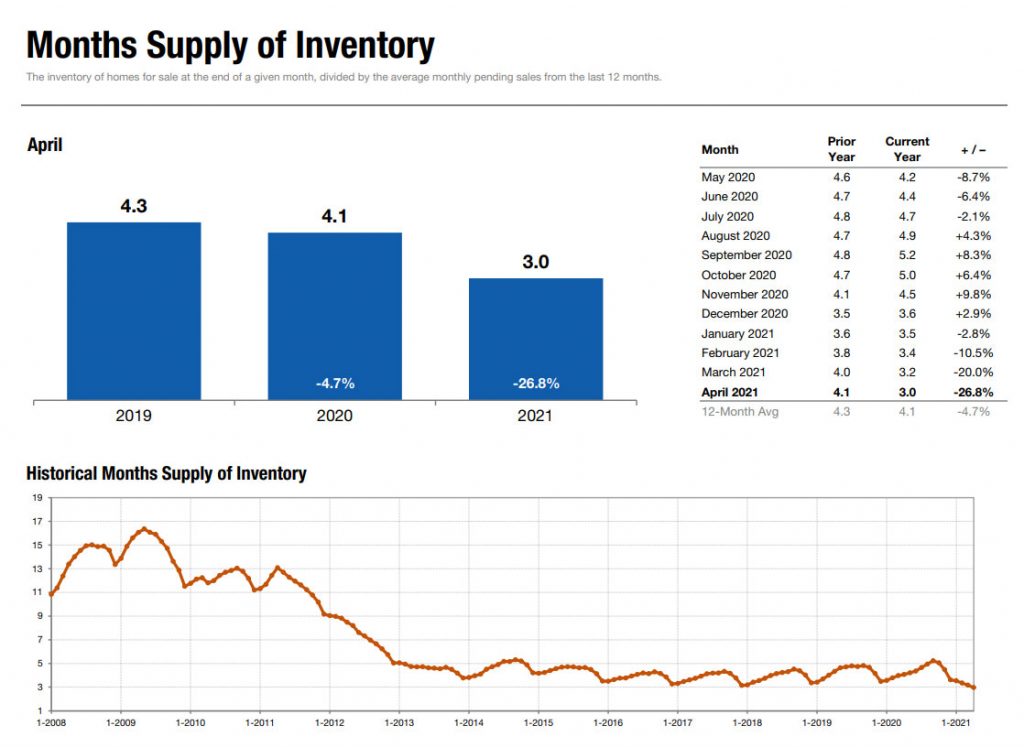
With MarketStats, gathering inventory data is simple. FastStats* features a full page on the Months’ Supply of Inventory. This gives you year-over-year and month-over-month data on the inventory of homes for sale at the end of a given month, divided by the average monthly pending sales from the last 12 months.
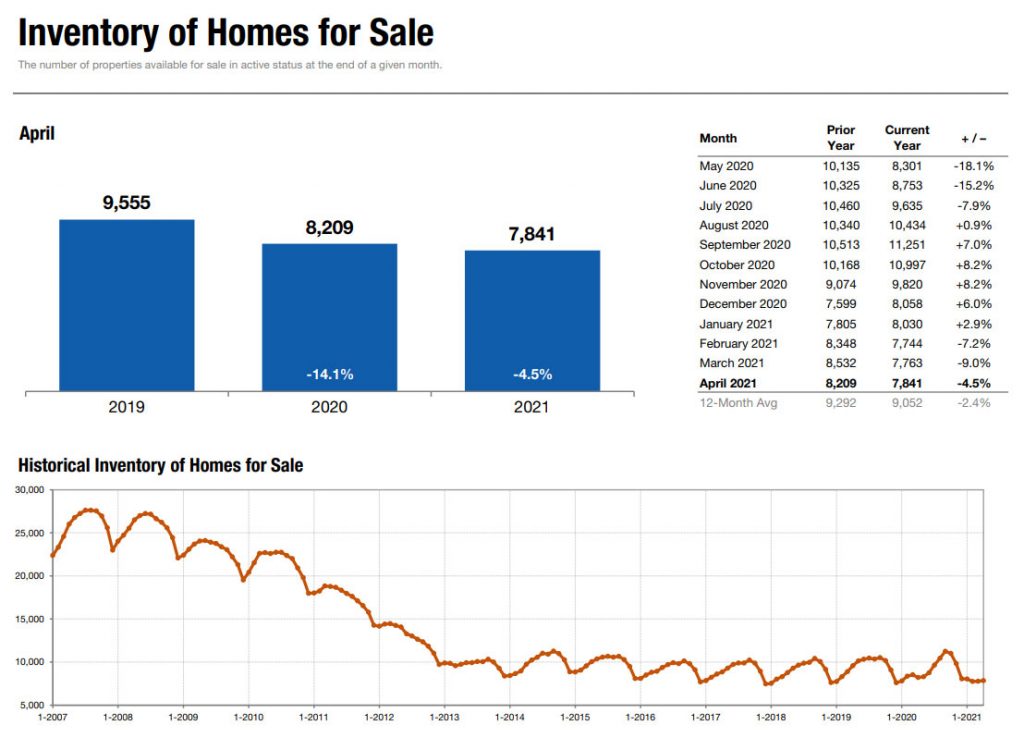
There’s also a full page on Inventory of Homes for Sale included in the report. This shows year-over-year and month-over-month data for the number of properties available for sale in active status at the end of a given month. In the examples below, the data are displayed in easy-to-understand graphs that can effortlessly be shared with clients.


InfoSparks* can also be used to determine Months’ Supply of Inventory. You can build a graph comparing up to four areas and choose the Months’ Supply metric in the bottom menu. This graph can easily be shared on your website or social media profiles or simply printed or emailed directly to your clients.

Today’s market can be challenging, but with the right data to back your decisions and a proactive approach, you can be sure you’re giving clients the best possible experience.
* Data, features and products may differ per market. Not all markets have both InfoSparks and FastStats.
If you’re a real estate professional and belong to an MLS that subscribes to MarketStats by ShowingTime+, you already have access to useful reports and charts for every situation.
For MLS and association staff who need to quickly generate reports and charts that summarize local market activity, MarketStats by ShowingTime+ can help. Click the button below to contact us for more information.


