

To that end, we’re excited to provide you with a recap of Q2’s home showing activity. As you may know, we track showing activity monthly with the ShowingTime Showing Index® and as we did last quarter, we thought it would be interesting to reflect on the last three months to consider if it could be a preview of what’s to come as we head into the dog days of summer.
April 2022

Full recap: April 2022 Showing Index Results: “Unusual” Slowdown in Activity Seen
Q1 showed the first signs that a slowdown in home showing activity may be in store for the country, a reversal from the growth observers came to expect after the historic run of unprecedented year-over-year growth seen throughout the country in 2021.
The start of Q2 continued that trend, as April marked the first time in 2022 that all regions in the U.S. reported drops in home showing activity.
“A combination of tapering demand and comparisons to the hectic pace set last year partly explain April’s decrease, though the numbers still indicate robust buyer activity. The top 25 markets averaged more than 14 showings per listing, with Burlington, Vt., and Bloomington-Normal, Ill., leading all markets with 20.30 and 16.42 showings per listing, respectively. Other busy markets included Richmond, Va.; Denver; Akron, Ohio; Rochester, N.Y.; and Bridgeport, Conn.
Regionally, the Midwest’s 7.3% year-over-year decline in buyer demand was the lowest, followed closely by the Northeast’s drop of 8.6%. The South saw an 11.6% decline in showing activity year-over-year, with the West’s 35.3% decline rounding out the regions.”
May 2022
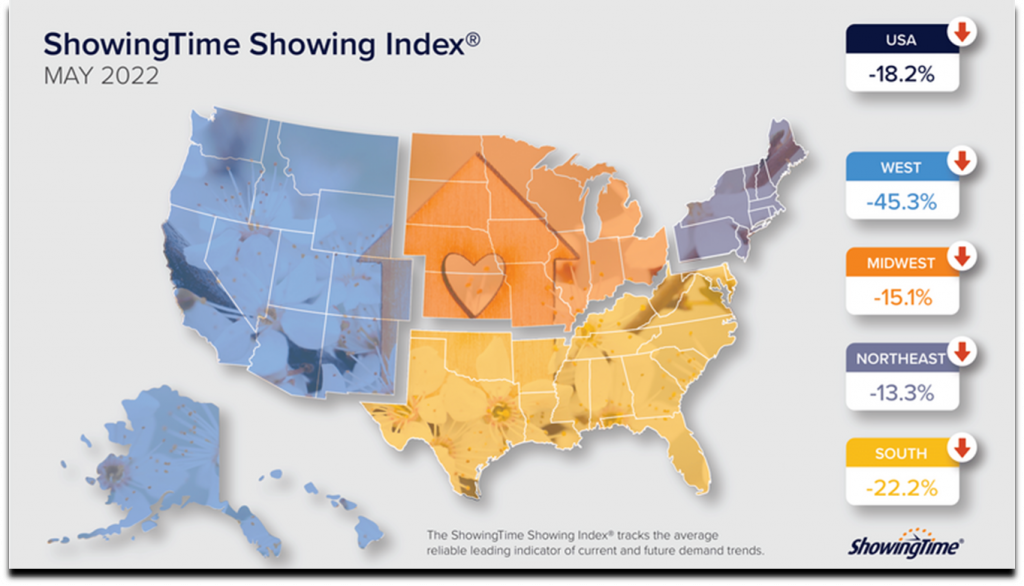
Full recap: May 2022 Showing Index Results: Showing Activity Continues to Slow Nationwide
May picked up where April left off as all regions in the U.S. once again experienced year-over-year dips in home showing traffic. The West again saw the most significant drop in showings, reflected in the fact that western markets Denver and Seattle – frequently leaders in the average number of showings per listing since last year – both failed to make the top 25 list for activity.
“The smallest drop was in the Northeast, according to the ShowingTime Showing Index®, where its 13.3% decline was relatively modest compared to the other regions: the Midwest was down 15.1% year over year, the South was off 22.2% while the West’s 45.3% decline in buyer activity was the most significant. Overall, the U.S. recorded an 18.2% downturn in activity in May.
Notably, the perennial leaders in buyer activity over most of the past year – Denver and Seattle – both fell out of the top 25 busiest markets, with each averaging around 10 showings per listing, breaking a streak that began in early 2021. The slowdown continued a trend that began this spring, ending what had been a months-long streak of year-over-year growth in buyer activity across the U.S.”
June 2022

Full recap: June 2022 Showing Index Results: Buyer Demand Cools as Showings Decline from Record-Breaking Highs
The second quarter ended as it began with the pace continuing to cool, led by the West again seeing a slowdown in buyer demand compared to record traffic in 2021. Though traffic fell throughout Q2 2022, ShowingTime Vice President and General Manager Michael Lane noted the importance of contextualizing the activity compared to last year’s historic highs.
“‘Most markets are experiencing a slowdown in buyer activity, especially compared to the historically high traffic seen last year,’ said ShowingTime Vice President and General Manager Michael Lane. ‘While summer is a slower time of year for real estate compared to spring, the dip we’re seeing compared to last June suggests this slowing is more about a re-balancing of an overheated market than just marking the end of the home shopping season.’
The decline in home showings across the country is another indicator that the housing market may be moving toward re-balancing, as inventory improves and competition among home buyers eases. The Northeast saw the smallest drop in June, with a 10.9% dip in showings. The Midwest followed with a 16.7% drop, while the South’s 25.9% decline and West’s 44.1% downturn rounded out the regions. The U.S. overall had an 18.7% fall in buyer traffic compared to this time last year.”


A look at what’s to come: For the latest Showing Index updates, be sure to subscribe to our blog. You can also view localized showing data at the state/province level, updated daily, in our daily showing activity tracker by clicking here.
ShowingTime services help agents representing buyers and sells alike. Whether you already use ShowingTime as an MLS/association feature and are considering an upgraded level of service, or you’re new to the ShowingTime ecosystem and want to learn more about our offerings, our dedicated Sales Team is available to discuss your business needs. Click the button below to reach out to them today.


