

Now, as we approach the release of our first look at buyer activity in the second quarter of the year with the April Showing Index, we thought it would be helpful to provide a recap of how the year has progressed so far.
January 2022

Full recap: January 2022 Showing Index Results: Buyer Activity Leaps as 83 Markets Hit Double-Digit Showings Per Listing
2021 was a year for the record books, ending with a jump in buyer traffic throughout the country even as the holiday season progressed. Given the torrid pace in which showings continued throughout the year, all eyes were on the Showing Index as the first insights from 2022 became available.
Observers weren’t let down once the January 2022 Showing Index was released, as all but one region saw growth that month. Moreover, the growth equated to truly impressive numbers of showings per listing in multiple markets, exemplified by the activity seen in Seattle and Denver.
“In January, the entire country experienced a 7.7% year-over-year uptick nationally in home tours, according to the latest data from the ShowingTime Showing Index®. The top 25 markets were up an average of 14% compared with the heavy traffic numbers recorded last January.
As was the case in much of the last year, Seattle and Denver recorded the highest showings per listing in January, with 26 and 25, respectively. Of note, Seattle showed a 2% drop in showings year-over-year, due to record activity in January 2021. Its number of showings outperformed all other markets nationwide, regardless. Salt Lake City; Boulder, Colo.; and Manchester, N.H. trailed Seattle and Denver, all averaging 17 showings per listing, while Orlando, Fla. and Dallas each had 16 showings per listing to begin the year.”
February 2022

February picked up where January left off, as once again all regions other than the West saw growth year over year in home showing traffic. And as was the case in January, a significant number of markets saw an average of double-digit showings per listing as demand outpaced available inventory.
“Even compared to last year’s early spring frenzy of home tours, the number of markets averaging double-digit showings per listing jumped 45% from 75 to 109, according to the ShowingTime Showing Index®. Many markets matched last year’s intense buyer demand while others saw big year-over-year increases: among the top 25 busiest markets, Nashville was up 43% year over year; Orlando, 36%; and Bridgeport, Conn., 30%.
Other cities among the 25 busiest markets recording big year-over-year gains included Dallas, up 29%; Hartford., Conn., and Sarasota, Fla., up 28%: and Charlotte, N.C., up 24%.”
More Resources for Handling Today’s Busy Market: Easing the Pain of Low Inventory with ShowingTime |ShowingTime Features to Take the Heat Off Buyer’s Agents this Summer | How Brokers are Using Offer Manager by ShowingTime to Navigate Today’s Busy Market | 4 Tips to Help You Declare Your Independence from the Office
March 2022
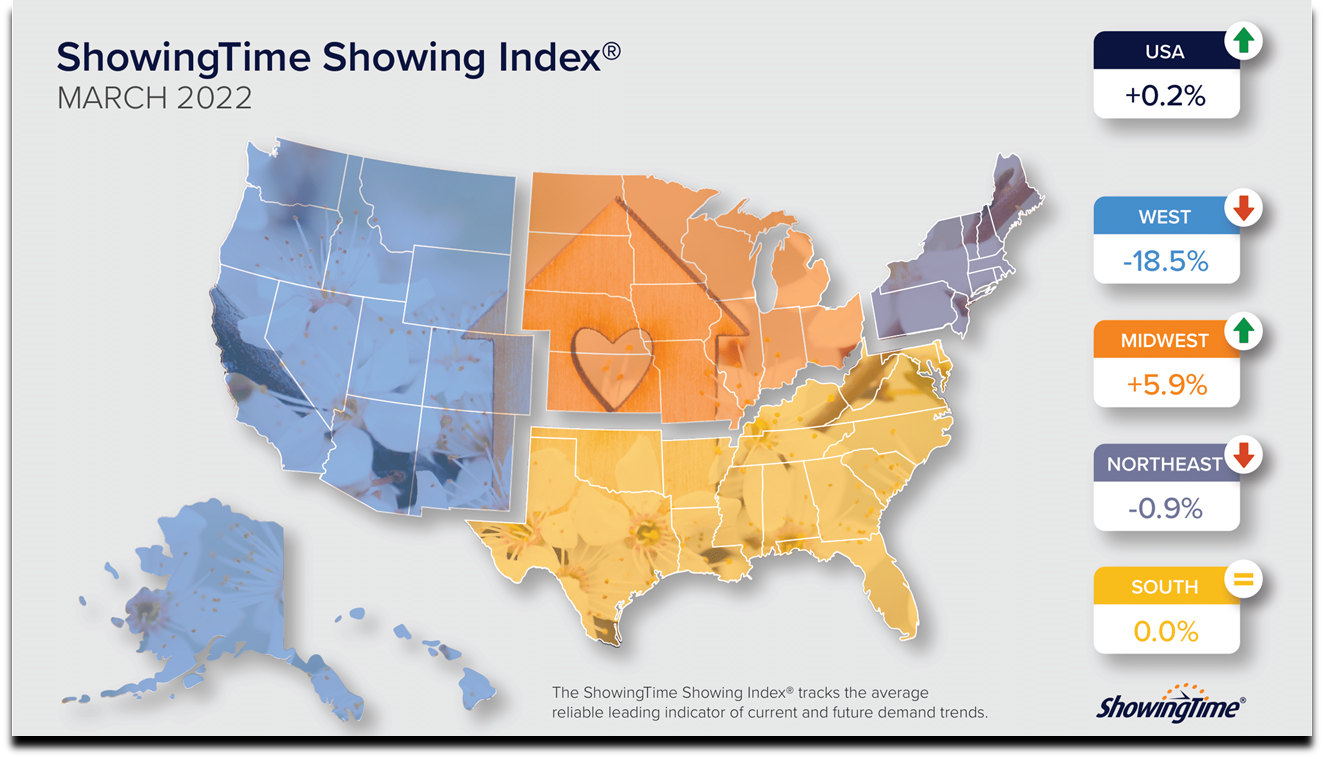
Full recap: March 2022 Showing Index Results: 121 Markets Nationwide See Double-Digit Home Showings Per Listing
In marked contrast to the first two months of the year, showing traffic in March 2022 was muted throughout much of the country, with the Midwest’s increase and the South’s parity in activity compared to March 2021 driving the country overall to experience only a modest 0.2% increase year over year.
“March’s showing activity stands in contrast to March 2021’s torrid pace, in which each of the four regions in the U.S. saw year-over-year growth in foot traffic of at least 40%. The 25 busiest individual markets averaged more than 16 showings per listing, including Burlington, Vt.; Bridgeport, Conn.; Fort Collins, Colo.; and Bloomington-Normal, Ill. The growth in the number of markets with double-digit showings jumped from 83 in January to 109 in February and 121 markets in March of this year.
‘We are sensing a slight slowdown in the Western region of the U.S. in year-over-year Showing Index values, although there is still very strong activity,’ said ShowingTime Vice President and General Manager Michael Lane. ‘The demand per listing is still at historically unprecedented levels, but for the first time in the last 12 months it is neutral.’”


A look at what’s to come: For the latest Showing Index updates, be sure to subscribe to our blog. You can also view localized showing data at the state/province level, updated daily, in our daily showing activity tracker by clicking here.
ShowingTime services help agents representing buyers and sells alike. Whether you already use ShowingTime as an MLS/association feature and are considering an upgraded level of service, or you’re new to the ShowingTime ecosystem and want to learn more about our offerings, our dedicated Sales Team is available to discuss your business needs. Click the button below to reach out to them today.


