
Showing traffic is slowing. Closed sales and pending sales are expected to drop during the winter months, while Days on Market increase. And, as many real estate professionals know, that’s to be expected as seasonality begins to impact industry metrics.
But … could this seasonal slowdown be the start of something more? After all, inventory remains tight. Average home prices keep rising. And some major markets are beginning to see fewer transactions.
Something’s got to give, right?
That thought has no doubt been, if not quite the talk of the industry, at least water cooler conversation.
And while concern is warranted, it’s important to remember two facts:
- Every market is different.
- Numbers are unbiased.
To illustrate the above, let’s turn to ShowingTime’s market stats tool, InfoSparks, and compare Months Supply of Inventory (MSI) over the past three years in three different markets. We’re choosing this metric because it’s a good indicator of supply vs. demand*.
*A note on MSI: A number less than four indicates a seller’s market, while a number greater than six indicates a buyer’s market.
To begin:
- In the upper left corner, select your desired area and price range. (For these examples, we’re selecting the entire MLS area and All Price Ranges.)
- On the bottom toolbar, select Months Supply.
- On the right side of the graph, select 3 Years and Monthly.
Let’s start with Region A:
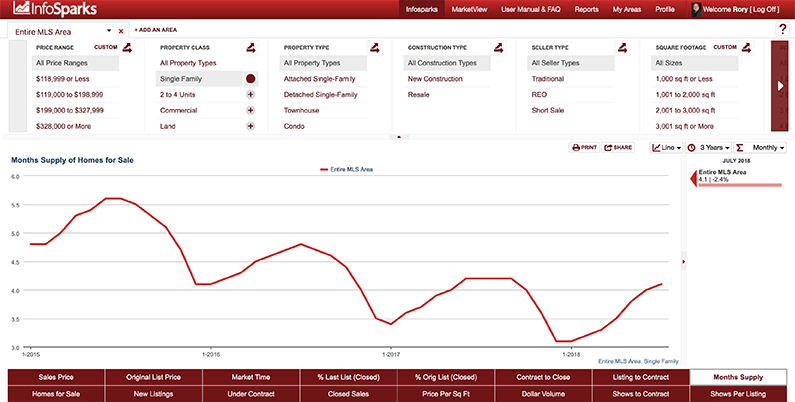
As you can see, September is when MSI typically starts decreasing in this area. Because we don’t have September numbers yet, let’s compare July numbers, which are the most recent available:
- 2015: 5.6
- 2016: 4.8
- 2017: 4.2
- 2018: 4.1
Although there’s been a slight year-over-year decline in MSI in this region, we can reasonably predict it will be a balanced market moving forward.
Now let’s look at Region B:

You can immediately see MSI has steadily declined in this region. Using July numbers once again:
- 2015: 7.5
- 2016: 5.3
- 2017: 4.1
- 2018: 3.1
MSI in this area has dropped by more than half during the past three years. This indicates it’s more of a seller’s market than a buyer’s market.
On to Region C:

This area experienced a bump in MSI of nearly one full data point in 2017 but this year returned to previous numbers. Once again comparing July:
- 2015: 8.7
- 2016: 9.0
- 2017: 9.7
- 2018: 8.5
These three examples prove the aforementioned facts: Every market is different, and numbers are unbiased.
They also prove another underlying fact: Real estate professionals provide extreme value to their clients.
We looked up these numbers using InfoSparks in our Chicago headquarters. We know MSI has varied in different regions. It’s a fact. But we don’t know, without our boots on the ground in those areas, why.
Agents armed with a market stats tool such as InfoSparks in this area are not only uniquely qualified to tell their clients whether or not this is a good time to put their home on the market, but also show them in a clear, unbiased way.
After all, numbers confirm that what you think is happening is actually happening.
Do you have the market statistics you need at your fingertips?
If you’re a real estate professional and belong to an MLS that subscribes* to MarketStats by ShowingTime, you already have access to useful reports and charts for every situation.
For MLS and association staff who need to quickly generate reports and charts that summarize local market activity, MarketStats by ShowingTime can help. Contact us for more information.
*MLSs and associations subscribe to MarketStats by ShowingTime to provide ready-made statistical tools for members. MarketStats is currently sold only to MLSs or associations.