

For a complete look at daily showing data nationally and for most states / provinces, visit our COVID-19 showing activity tracker here.
June 29
Like most data practitioners, we’re tracking closely the increases in daily cases of COVID-19 across the US. Yet, as of today, the increase in the number of cases hasn’t had a significant impact on or clear discernible correlation with the level of real estate activity across the states.
On average, we are handling 15 percent more showings than last year when comparing seasonal traffic, but that’s not the full story. If we look at our Showing Index – which tracks showing traffic per listing, adjusting the stat for the number of available properties – the year-over-year increase was a whopping 21.4 percent in May, and is likely to come in even higher for June . This will likely continue to push the prices higher due to increased competition and unless new listings come on the market start slowing down the count of closed sales.
June 11
For the past 17 days, daily showing traffic has exceeded the 2019 levels. Usually showing traffic subsides mildly after Easter, reaching a plateau where it stays for the summer months. This year, however, looks drastically different as the busiest time hit us in early June.
So far, we don’t know how far the rebound will take us. Daily traffic is expanding with a roar – 8 percent week over week in the last few days – despite the difficult political climate. Ultimately, showings will be limited by low inventory, but the increased demand is creating a feedback loop, where sellers who would have previously given up on selling this year, are instead trying again as they see the price increases across the country.
It’s time to also look at the impact on 2020 as a whole. Though the current showing traffic is back to normal, on a cumulative basis so far this year, we’ve had 21 percent fewer showings compared to 2019, leading to fewer sales and less revenue for industry players. There are signs that this gap will close at least partially. If we continue to run 7 percent over last year as we did yesterday, it will take about 70 days to fully make up the annual shortfall. We will report on this in the coming weeks.
May
May 29
When we started these updates two-and-a-half months ago, my opening sentence stated these updates track the impact of COVID-19 on the real estate markets. However, if somebody came back from space today and looked at the showing data counts over the last week, they might have missed the fact that we are still recovering from a slowdown of unprecedented proportions.
The showing traffic is back in full force. It’s slightly higher than it was at the same time last year, and is above the March 2020 levels in all but six markets. Only New York remains down substantially from pre-pandemic levels (-28 percent), but is recovering at an accelerating pace. For Pennsylvania it took seven days to recover to the normal seasonal level after restrictions were lifted. And other states that are down slightly seem to be more affected by seasonal variations at this point.
Yet, like other real estate professionals, we feel that real estate markets are changing rapidly in deep fundamental ways, but the day-to-day analysis of the instantaneous situation no longer yields significant insights. Over the coming weeks we will need to look at longer time ranges across different types of markets, paying closer attention to the methods and coordination patterns between agents, to understand the nature of these changes
May 20
At this point the daily showing traffic has come back to the level immediately preceding the onset of the epidemic. Given the trajectory of the increase, we should expect the increase to continue beyond this level, especially as the activity returns to Pennsylvania and New York – the two states that continue to have substantially reduced levels of showing traffic. New York in particular has been slowly accelerating, recovering close to 50 percent of the expected traffic.
As the situation stabilizes I will continue to post my updates, but less frequently transitioning to one or two updates per week. However, we continue to proof and publish our charts daily here.
May 13
By now, 12 states are hitting maximum traffic level for the year, exceeding the traffic levels for the first week of March. Though all states continue to increase week over week, adjusting for slower traffic over the weekend due to Mother’s Day, the rebound is showing signs of slow down in 15 percent of states that have reached annual maximums first. These states, which include Arkansas, Alabama, Mississippi and Ohio among others, are posting less than 5 percent week-over-week increases since the weekend.
May 11
In the next few days the trends in our charts may be somewhat concealed as the lower traffic on Saturday and Sunday (as is usually the case on Mother’s Day) will pull down the seven-day moving average we report on, but the overall rebound seems to keep going at a steady rate. Michigan’s chart (see below) in particular is perhaps one of the more self-explanatory and impressive charts our team has seen, with showing traffic recovering basically to the normal run-rate over the course of eight days. Tracking Michigan might be particularly important as it can provide a way to quantify the pent-up demand, to see whether after the initial surge the steady-state will be at a lower level, which might shed some light on how New York and Pennsylvania traffic will fare after the restrictions are lifted.

May 8
As expected, on Wednesday national traffic has crossed back into the positive territory compared to the first full week of the year. Twelve out of the 41 states we track by now have reached new highs for the year. This is especially impressive since for the purpose of this discussion we are tracking absolute number of showings (as opposed to our Showing Index, which tracks showings per listing). This accelerating stream of buyer traffic is concentrating on the reduced levels of inventory, which means that showings per listings are probably trending even higher. You can glimpse the pent up demand if you look at the Michigan rebound. It took only four days to get to 70 percent of the regular daily traffic, which is an astounding feat of coordination among the real estate professionals. We are still kinda shocked by this, and will be perusing the data over the weekend to see how such massive concerted movement this week was even possible.
May 6
The rebound continues without any signs of slowdown. If anything, it has accelerated slightly in the last three days running at about 17 percent in week-over-week increases. In the coming days there will be additional tailwinds related to Michigan reopening tomorrow morning. Even prior to the reopening we’ve received over 12,000 showing requests there as of this afternoon for the upcoming days. On Saturday and Sunday the traffic will slow down though, as is usually the case on Mother’s Day weekends.
May 4
Though the traffic remains suppressed in many markets and is still virtually at zero in Michigan and Pennsylvania, the national 7-day moving average is projected to exceed the volume of that in the first week of January, which we’ve been using as the benchmark for showing traffic since the start of the crisis. The rebound has continued so far without any signs of slowdown.
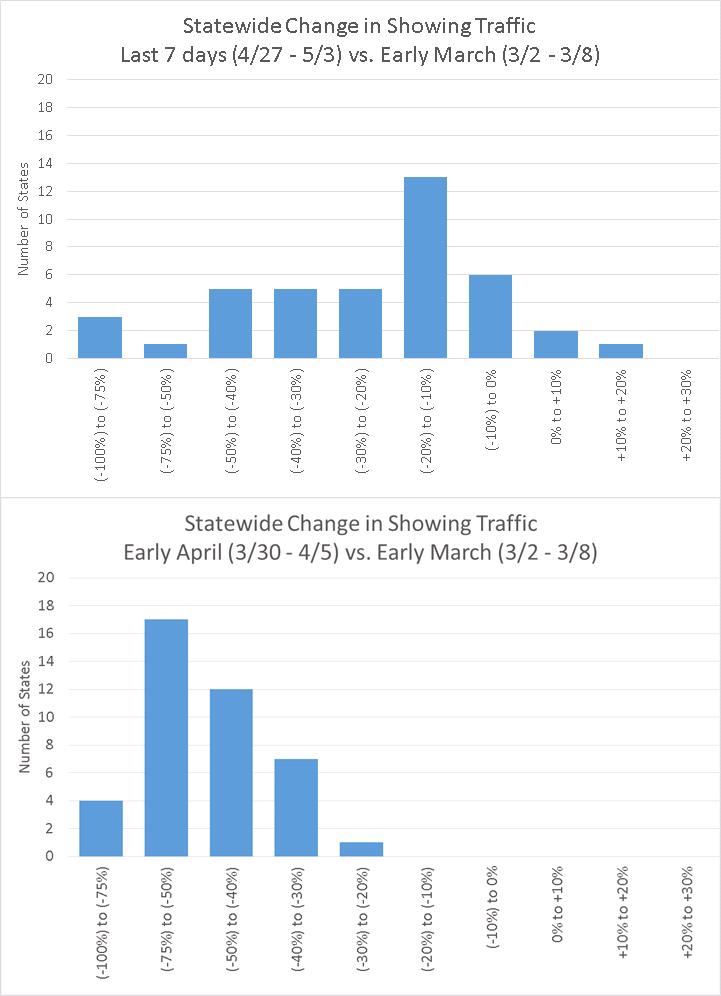
Below are charts comparing the magnitude of declines in showing traffic from the peak volume periods of early March 2020. A month ago, the median drop in showing traffic at the state level was -51 percent; as of today, it’s at -20 percent. In fact, a growing number of states are actually poised to reach new highs for the year in the coming days.
May 1 – Addendum
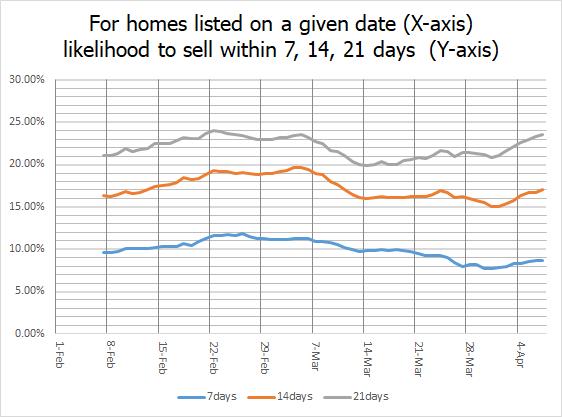
As an addendum to my daily update, we are starting to see how COVID-19 affected people that had to go through a real estate transaction and the data are nuanced and, in my humble opinion, surprising. Look at the chart below, for example, which is based on one of our client markets (so it’s not a national chart, but is at least anecdotally interesting). If you look at the homes coming on the market prior to the onset of the epidemic and those homes that were put on the market since mid-March, the likelihood of going under contract in just a few weeks has largely remained the same. If you’re a seller, you were just as likely to find the buyer as before in this market. Homes listed in early February had 22 percent chance of getting under contract within three weeks, and for homes listed in late March this probability was essentially the same at 20-21 percent. Before seeing this graph I would’ve been sure that the chances of selling would’ve dropped during the epidemic, but it seems that supply and demand adjusted in almost perfect alignment.
May 1
The rebound continues at a robust pace of 12-15 percent week over week. For the first time since March 20th, the showing traffic is less than 10 percent off from January’s level. Of course, April is supposed to be substantially above January depending on local seasonality factors, but it’s still an impressive bounce from being down 50 percent in early March. The majority of states are now above the level of that seen during the first week of January. The reason the national data are still below is in part because MI, PA and NY still have very low levels of showings, but we believe one can look at Colorado chart to see an approximate blueprint for how showings rebound after the state lifts the shelter-in-place orders.
April
April 29
The rebound continues with 12-15 percent week-over-week increases posted daily at the national level. However, for the first time since the start of the rebound, in a number of states with high levels of showing traffic in our system, such as Texas, Illinois and Arizona, the traffic seems be settling up only 5 percent week over week so far. A number of states, Colorado most notably, continue to accelerate rapidly driving the overall growth factors higher. It seems that the relative levels at which the states tend to stabilize vary by state, Texas is only 20 percent off the normal level of activity, while Florida, though its timeline resembled that of Texas, is still 40 percent off the expected levels for this time of the year.
April 27
Over the weekend the showing traffic continued to grow week over week and the rate of growth actually picked up back to 15 percent week-over-week. Part of this came from Colorado, where beginning last Friday showings began to cautiously trend upwards, though they continue to be down 85 percent–plus from expected levels.
April 24
Daily showings continue to trend up week over week, although the 15-16 percent change earlier in the week slowed down to 9-10 percent on Thursday. Fridays are particularly important – usually being the most active day of the week for scheduling showings, so I will be checking over the weekend to see how today went.
April 22
So far this week, showings continue to increase by 15 percent a week nationally. The increases are pretty consistent across all states. Median week over week change at the state level is also 15 percent, although some states that did not accelerate as fast in previous weeks are now posting double digit gains on a smaller base number.
Additionally, we release our March Showing Index today, which provides a good summary of the turnaround we’ve been seeing. You can view it by clicking here.
April 17
Daily volumes continue to increase. Although it may not feel that, way showings were up 48 percent from Friday two weeks ago. We are up 27 percent from last Friday, but Friday before Easter is usually 5-15 percent slower than normal based on traffic patterns in previous years and might not be a great reference point. We also took a look at the price range distribution for the rebound, and the rebound is more pronounced for homes in the $300-$500K range, as well as higher priced homes at $800K or more (which was surprising to me). All price ranges are up, but these price ranges account for the larger share of the increase.
April 16
Daily numbers continue to inch up, as Wednesday was up 32 percent (29 percent on Monday and 30 percent Tuesday) over last week with Texas, Illinois and Florida posting largest increases in the absolute number of showings. Thursday and Friday numbers will be less meaningful, owing to late last week’s regular pre-Easter slowdown, but there is definitely a moderate but persistent upward momentum right now.
April 14
As expected based on the last week of activity, showings continue to increase across the board. Yesterday, showings across the country jumped 29 percent week over week — the largest increase since the onset of the pandemic. We should note that the Monday after Easter usually gets an additional boost of about 10 percent as showings that would’ve occurred on the weekend get shifted to the following week. Nevertheless, it confirms that there is an underlying demand in the economy, although we continue to be 60 percent off from the levels we should have reached in a normal year. Still, it’s a sign that certain buyers are slowly returning to the market.
April 13
The data over the weekend was in line with what we observed last week. The decline has stopped and showings are rebounding moderately. Friday was up 19 percent week over week. Saturday and Sunday were down, but if you adjust for Easter, which usually causes a 70 percent drop in showings, the showings tracked as though they would’ve been also 20 percent week over week.
April 10
The data coming in in the last three days confirm our earlier assessment that the downward adjustment has stopped and a moderate bounce is under way. Thirty states are unchanged or posting substantial week-over-week increases in the daily number of showings. The only state with a very drastic drop-off is Colorado, where showings have slowed down temporarily due to real estate not being deemed an essential service.
The data being generated today and over the weekend will be more difficult to analyze, since showings are always down on the Easter weekend. This will throw off week over week and year over year comparisons. We will report what we see over the weekend next week and talk more about how to look at the data on the adjusted basis.
April 8
April 7 was the first day this spring since March 11 when the showing traffic increased week over week. On March 30 we were almost flat, but slightly negative; this time, Wednesday was 2 percent above the previous week. The situation also feels more stable, as most states are either posting steady gains in traffic or staying flat and have had steady trends pointing that direction over the last week, as the decline slowed and even reversed slightly. Only 12 states were negative, and other than Indiana, Missouri and Georgia, were pretty much within margin of error. At the same time, 12 states posted 10 percent-plus increases from a week ago. To me, this broad correlated movement across states suggests that unless there are major new unexpected developments, we can assume that the adjustment from the immediate effects of the pandemic is complete.
Next weekend, data will be somewhat confusing as the traffic always declines on the Easter weekend and then compensates for it slightly early in the following week, but please continue to check back for updates.
April 6
The week-over-week declines continue to slow, although the decline has continued as we were down 8 percent week over week. As we discussed previously, the decline is happening in markets that haven’t slowed down as much to date and is partially offset by moderate rebounds in markets that had dropped the most in previous weeks.
April 3
Showings picked up from yesterday, although they are still down 10 percent week over week. Part of the increase came because of strong gains in Texas, and the jump in showings in New York after the state reconsidered and included real estate on the list of essential services.
April 2
Although earlier in the week we had a slight up day from last week, overall this week will post a further decline of about 15 percent from a week ago, even though traffic has stabilized in some states. Tomorrow, our team will take another look at the dynamics for different price bands.
April 1
Showing traffic trends do not have a clearly defined direction, driven by local situation and state government actions. We will spend some time reassessing different aspects of the slowdown now unless a pronounced trend emerges again.
Today we took a look at the cancellation dynamics, for example, while the adjustment was going at full speed. Usually 18 to 19 percent of showings get cancelled, rescheduled or declined by either side. Cancellations often require extensive coordination by our employees, so we track the aspect closely. In the last two weeks, this percentage has climbed noticeably to 22 to 23 percent, which is about a 13 percent increase. I would’ve expected those levels to be even higher. In the last week, however, the cancellation rate has dropped to return to normal levels.
March
March 31
Looking at yesterday’s data, we’re definitely seeing signs of stabilization. At this point 33 of the states (roughly 70 percent) we track have either had cautious rebounds from a week ago or remained at the same level. Twelve states have posted 20 percent-plus increases in daily traffic from a week ago. This, of course, must be taken with a grain of salt, as these rebounds are from unprecedentedly low levels. However, even overall the national 7-day moving average seems to have stabilized and appears flat over the last two to three days for the entire North American region, which suggests to me that the adjustment might be complete. We’ll continue to report how the week progresses in the coming days to see if this situation persists.
March 30
Looking at the numbers over the weekend, showing traffic continued to subside, but at a significantly lower rate compared to last week. It’s important to note that for the first time this week in 20 states the week over week traffic remained in line with last week’s, either rising or declining slightly by less than 5 percent — a normal range of variation around this time of year. If the current trend continues, we should be stabilizing within a week in terms of overall traffic.
March 27
During the last few days traffic has been holding steady at about 33 percent off of last week’s levels. In the last two weeks we have seen drastic reductions over the weekend. We will monitor the situation over the weekend to see whether this patterns continue or whether we will stay at the current level.
March 26
While the 7-day moving average continues to head down, daily traffic ticked up on Wednesday compared to Tuesday. If we compare this Wednesday to the top Wednesday on record for each state, the median decline in showings is 50 percent. There are only three states that declined by about 30 percent: Nebraska, New Hampshire and Minnesota.
March 25
After the adjustment we saw on Monday (a 37 percent drop from already suppressed previous Monday), Tuesday traffic was consistent with Monday’s without further day-to-day declines. It might be that traffic is adjusting over the weekend while remaining at the “new normal” rate during the rest of the week, but we will need to get more data points on this. Of course, government actions last week were mostly timed prior to or on the weekend, which might have contributed to this pattern.
March 24
On Monday, showing traffic slowed down further on the adjusted basis. A significant contributing factor was of course the industry responding responsibly to government actions. In some states showing requests were down more than 90 percent over the last two weeks. In most other states however, showing traffic continues, albeit at rates of 35-45 percent below where it was two weeks ago.
March 23
Sunday was another data point showing a “normal” day-to-day fluctuation at this abnormally low level of activity. Sunday traffic declined from Saturday, but not beyond the range expected given the daily count for the preceding week.
My hypothesis is that the “optional” housing activity that buyers and sellers could postpone was already delayed, and the activity still happening is more likely to involve buyers and sellers who, due to their life circumstances, cannot delay the process. A quick analysis of how showings declined by price supports this. If we look at the magnitude of the slowdown across different price ranges below, we can see that homes $300K suffered 35-45 percent declines in showing traffic over the last two weeks, while homes above $500K are still being shown, albeit with temporary declines in the 50-60 percent range.

March 22
Saturday activity typically drops 5-15 percent from Friday’s level and that’s exactly what we saw yesterday. This again suggests that in most cases we are continuing to be at a plateau, as opposed to a continuous state of decline. National numbers are down 38 percent from a week ago and 45 percent from two weeks ago, which is the last normal Saturday we had on record. If you look at the state level median and average decline over the last two weeks, we’re close and in the 36-38 percent range. Larger states declined more on average, possibly because of government action. Interestingly enough, we continue to see substantial, albeit subdued, appointment traffic in all states we cover.
March 21
Probably the most important insight for me, is that we are now at a 5-day plateau, not in free-fall mode. The daily traffic adjusted abruptly over last weekend, but since then the daily showing rate has been steady, even though the 7-day average we report continues to plunge. If this holds up through the weekend, by Monday the decline should “hockey stick.”
Here are the daily numbers:
Mon 126,854
Tue 126,654
Wed 131,560
Thu 133,052
Fri 139,211
We’ll see how things change in the coming days with the continued pandemic trends and government interventions.
March 20
Even though 7-day moving average (MA) continues to show substantial declines, today was the second consecutive day in which daily traffic actually saw a slight day-to-day increase. We’ll monitor this further, and we’ll soon know whether the adjustment actually happened over last weekend and stopped at this interim plateau 30 percent down from normal levels, or whether the declines will continue.
March 19
Yesterday was the first day in which there was no significant day-to-day decline in scheduled home showings. The 7-day MA continues to drop, but Wednesday’s daily traffic had an anticipated uptick from Tuesday and both days were roughly 30 percent off the levels expected under normal circumstances.
Yesterday we went down another 4 percent in showing traffic on adjusted basis, which is a significant daily decrease. It seems that the markets that are slowing down the most are essentially from the same group of markets that also felt the greatest impact in the 2008 housing crash.
March 17
As of last Wednesday, the impact of COVID-19 on the market was unclear. Over the weekend, however, we began to see definite signs of a slowdown. We estimate that the drop off in home showings is currently at about 11 percent.
March 16
We’ve started closely tracking the impact of the COVID-19 pandemic on real estate markets throughout North America. Assessing the data so far, we’ve not yet seen a significant drop in national buyer activity, though I think we will see the effects of COVID-19 in the week to come.
We compared the buildup of appointments in 2019 vs. 2020, tracking the 7-day moving average (MA) indexed to the first full week of the year. For context, a typical March week in 2019 was up 30 percent from the first full week in January.
The last 7 days in 2020 were about 40 percent above the first full week of 2020. What’s important is that we haven’t yet seen a dip in the weekly showing traffic as we usually would during major snowstorms. The data come from 100 of our top markets and are through March 12, 2020. In some markets we are seeing the traffic soften, but it’s not a sharp decrease; rather, we’re seeing the lack of week-over-week increases that are expected at this time of the year.


