

Throughout most of North America, home sales are on the rise as mortgage interest rates remain low. Buyers are looking to take advantage of low interest rates and sellers are looking to get top-dollar for their home in the low inventory, competitive market.
As an agent, you will often be asked, “Is it a buyer’s or a seller’s market right now?” But, how do you truly determine the answer to this question and provide supporting data? Look to InfoSparks!*
What defines buyer’s market vs. seller’s market?
When there are more homes for sale than there are people looking to buy, it is a buyer’s market, because there is more inventory for them to choose from. When there is more than seven months of inventory available in an area, it is a buyer’s market.
A seller’s market, on the other hand, is when there are more people looking to buy than there are homes for sale. Sellers can usually sell their homes at a higher price when inventory is low. If there is less than five months of inventory available, it is a seller’s market.
How do I determine the inventory in my area?
This is where InfoSparks comes in. Using the graphing features provided, you can set up an area you wish to analyze, such as the entire MLS or a ZIP code. You can even draw on a map the specific area you want statistics for. Then, you will filter by Homes for Sale and see what that number is for the last month. In the below scenario, there were 31,157 homes for sale in the indicated area in August. Be sure to use the monthly calculations setting when setting up this graph.

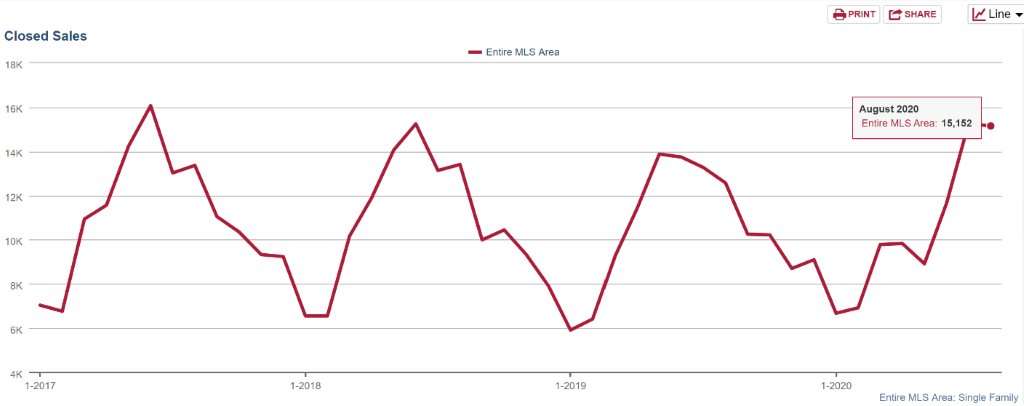
Next, filter that same graph by Closed Sales and also look at the number for August. In the below image, it shows 15,152 homes were sold that month.


Finally, to determine the month’s supply of inventory, take the number of homes for sale (31,157) and divide it by the number of homes sold (15,152) to get 2.1 as your result. This means inventory is very low and your area only has two months’ worth of homes for sale. This indicates a seller’s market, because things are selling quickly!
In some markets, InfoSparks is already equipped with a Months Supply filter that you can use on your graph. In this case, the math is already done for you and you can easily see the inventory for each month.
So, in order to stay on top of how the market is leaning and have the latest data in your area at your fingertips, use InfoSparks and never make an educated guess again!
* Available in select markets
If you’re a real estate professional and belong to an MLS that subscribes to MarketStats by ShowingTime+, you already have access to useful reports and charts for every situation.
For MLS and association staff who need to quickly generate reports and charts that summarize local market activity, MarketStats by ShowingTime+ can help. Click the button below to contact us for more information.


