

On top of accessing SmartCharts Pro on the go for convenient market insight when you need it most, here are five cool things you can do in SmartCharts Pro.
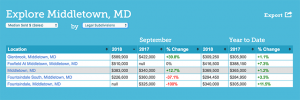
1. “Explore” on Steroids
See which subdivisions in your postal code are selling the fastest, which are most expensive or had the biggest sales jump, etc.
2. 10 Years of Market Trends
Provide your clients the full context of today’s market by comparing it to the housing bubble, crisis and recovery.
3. Supply and Demand
For instance, Months of Supply. (Remember: Four to six months is generally considered balanced. Anything less is a seller’s market.)
You can also use the charts to compare which price ranges have the most demand relative to supply.
4. Quarterly Increments
In lower-volume areas such as subdivisions, quarterly metrics often provide more relevant trends.
5. Chart Year-Over-Year Change
A year-over-year percent-change chart is great for plotting out when the pricing recovery started in a given area. You can plot the year-over-year change for any metric in SmartCharts Pro!
Do you have the market statistics you need at your fingertips?
If you’re a real estate professional and belong to an MLS that subscribes* to MarketStats by ShowingTime, you already have access to useful reports and charts for every situation.
For MLS and association staff who need to quickly generate reports and charts that summarize local market activity, MarketStats by ShowingTime can help. Contact us for more information.
*MLSs and associations subscribe to MarketStats by ShowingTime to provide ready-made statistical tools for members. MarketStats is currently sold only to MLSs or associations.
