Appointment Center
Streamlined showing and offer management for real estate agents
Appointment Center empowers real estate agents by giving them tools to simplify showing and offer management*, along with access to detailed market reports to guide productive conversations with clients helping them save time so they can reinvest in growing their business and provide exceptional client service.
*Subject to market availability of Offer Manager.
The subscription plan is now $15/month for agents. Contact sales to learn about other plans including team and office pricing.
Buy Now
Background Color Override.
Section: 0
Background Color Override.
Section: 1
The Complete, Affordable Package
For just $15 per month, you get everything you need to easily manage the real estate showing and offer process. From around-the-clock support to in-depth market analysis reports that focus on your market, Appointment Center has you covered.
Buy Now
Get Time Back In Your Day
Appointment Center offers tech solutions that save real estate agents time and alleviate the common pain points of managing a listing. With easy-to-use showing management technology, a dedicated mobile app, time-saving features like ShowingCart, and 24/7 access to live appointment specialists, agents can provide exceptional service for their customers.


Seamless Offer Management
Offer Manager helps you save valuable time by organizing offers by listing and automatically storing buyer's agent contact information, enabling efficient communication with buyer agents and sellers from a mobile device.
Valuable Real Estate Market Insights

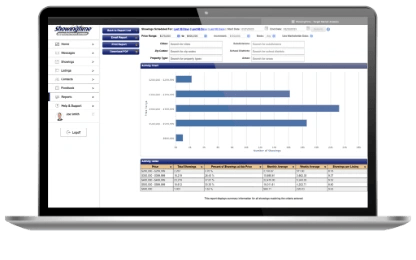
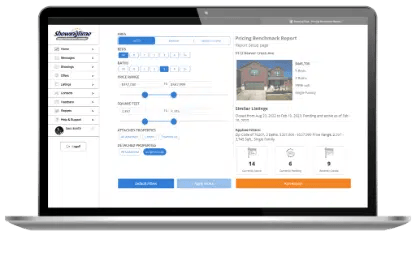
Target Market Analysis

