Selling a home can be scary, which is why sellers rely on expert agent insight to remain confident throughout the process. That insight can come in many forms, but when it comes to instilling confidence during pricing discussions, few are more valuable than insight gained from current local market data. Yet getting that data can be a time-consuming process, and even with data in hand, agents may struggle sharing the implications of findings in a way that their clients can easily digest.
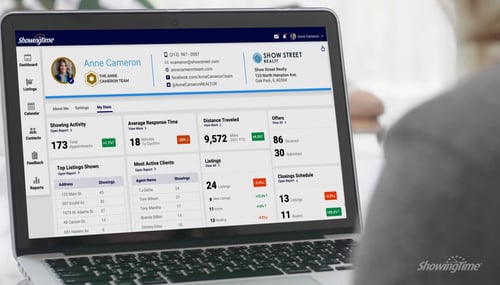
ShowingTime+’s Target Market Analysis report gets to the heart of that scenario by making it easy to view anonymized pricing and showing data from active inventory in their market and produce easy-to-read charts to guide client conversations. Best of all, the report is easily accessible by users of Appointment Center by ShowingTime+ and Front Desk by ShowingTime+ right from the same interface they use to manage showings!
The Target Market Analysis report uses available active inventory to give you intelligence on local market performance. For example, if homes in the price range of $150,000 to $199,000 are getting an average of five showings a week while those in the $200,000 to $250,000 range are getting eight showings, if your listing is close enough to the price range getting the most activity it may make sense to price the home on the higher end. Sharing this report with clients can help you demonstrate that your advice is supported by timely, relevant market intelligence.
See below for an overview of how to develop a Target Market Analysis report of your own.
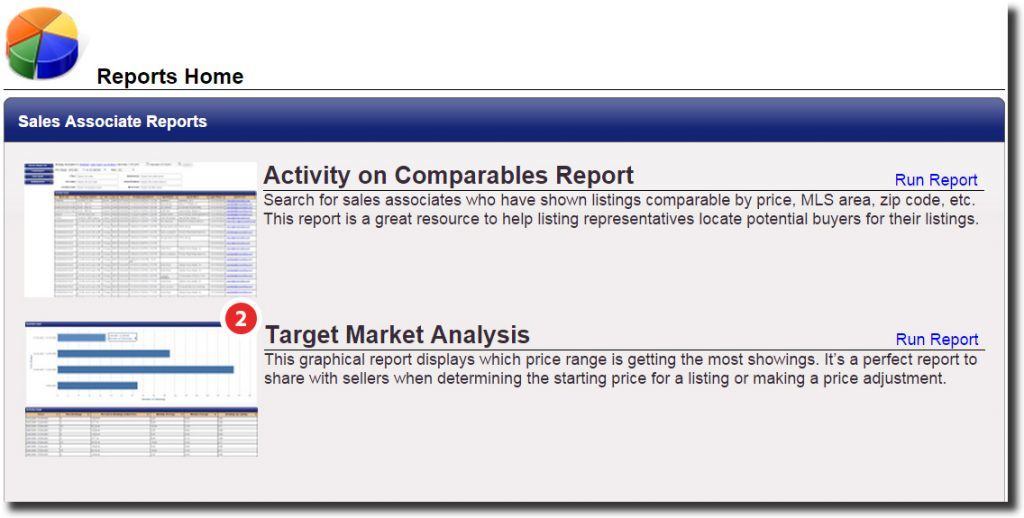
- First, find the Reports tab located at the left of the screen and click on it to view the list of available reports.
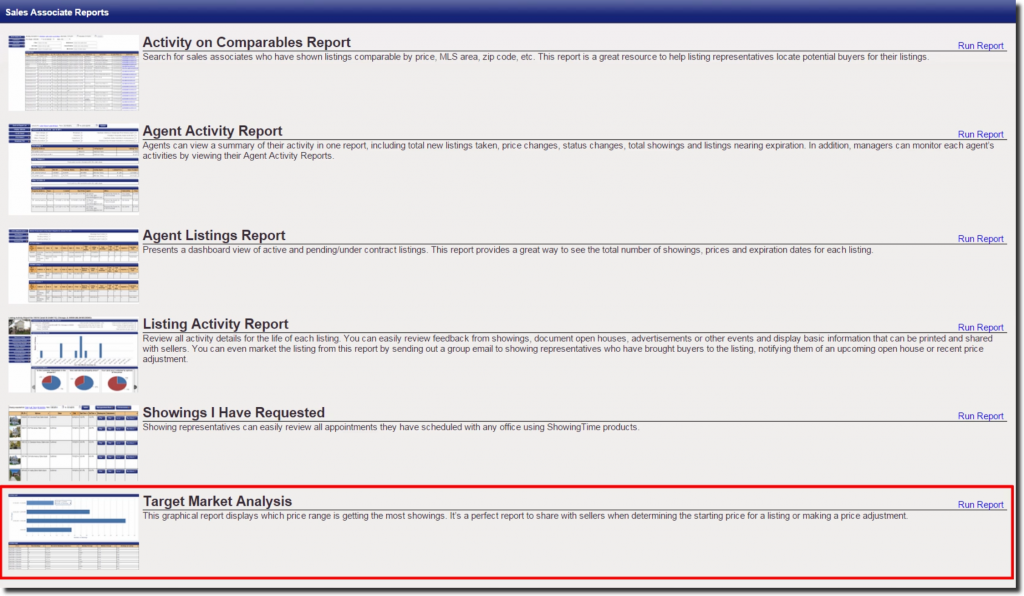
- Next, select Target Market Analysis.
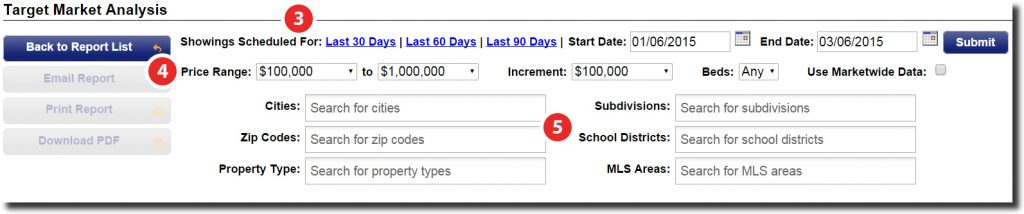
- Determine the criteria for the report you’d like to generate, starting first with the duration of time you’d like to obtain data for – either a range of 30, 60 or 90 days, or a custom date range.
- Select the price ranges and the increments.
- Optionally, select any additional data point you’d like to search by, including ZIP code, property type and more.
Once you’ve run your report, you’ll be able to view an Activity Chart, which provides a visualization that breaks down the number of showings by price range. Below that, you’ll find the Activity Detail chart, which provides further highlights on your search criteria, including insight into the percentage of showings at a given price, monthly and weekly averages, and the number of showings per listing.
With timely data in hand, you’ll be able to have more meaningful conversations with your clients and help them make pricing decisions they can be sure accurately reflect their market conditions.